
The primary principle in real estate acquisition emphasizes the importance of location. It is crucial to select investment properties in a market with growth potential.
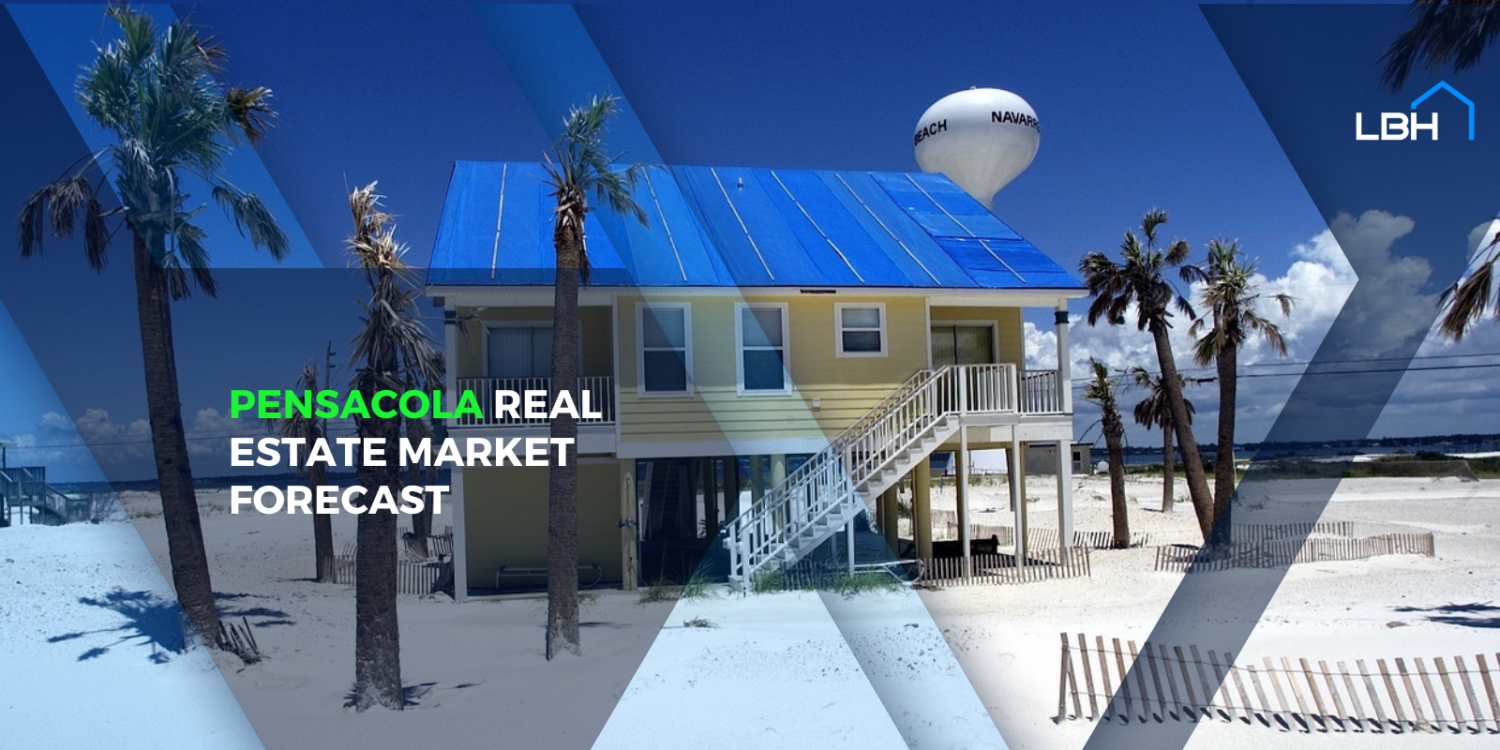
The Pensacola housing market stands out as a prime example, boasting a real estate market that consistently yields some of the highest profits nationwide.
If you are looking to buy, sell, or deal in the Pensacola real estate market, you’re in the right place. Find answers to nagging questions, including “Is Pensacola a buyer’s or seller’s market?”
Median Home Prices in Pensacola
As of August 2023, the median listing Pensacola home price stood at $335,000, marking a 3.1% year-over-year increase, according to data from Realtor.com.

Different neighborhoods posted wide-ranging home prices in Pensacola. The West Side had a median listing price of $359,900, while East Hill posted $550,000, according to Realtor.com. Homes in Scenic Heights had a median price of $319,900.
Here is a breakdown of Pensacola home prices in eight different neighborhoods:

Average Days on the Pensacola Housing Market
According to online realtor Redfin, homes in Pensacola sell in around 68 days, with these properties receiving an average of two offers. Hot homes get a new buyer in around 34 days.
This is compared to Navarre and Gulf Shores, whose homes take 66 and 28 days on the market.
Number of Homes Sold
There are 364 recently purchased properties available for purchase in Pensacola, with a median listed price of $358,000, according to Redfin. Among these listings, certain homes are considered “Hot Homes,” indicating they have a high likelihood of selling swiftly.
Over the previous month, 186 homes were successfully sold in the Pensacola area. Aside from single-family homes, there were 94 condominiums, 43 townhouses, and 6 multi-family units available for sale in Pensacola during the same period.
In 2024, Pensacola is expected to see a growth rate of 7.8%. Other metropolitan statistical areas (MSAs) in Florida are projected to witness significant increases in home prices. Here are the top 10 according to real estate marketplace Zillow:
- Clewiston, FL MSA: 9.7%
- Wauchula, FL MSA: 9.6%
- Palatka, FL MSA: 9.1%
- Key West, FL MSA: 8.5%
- Miami, FL MSA: 8.4%
- Sebring, FL MSA: 8.2%
- Lake City, FL MSA: 8.2%
- Ocala, FL MSA: 8.1%
- Naples, FL MSA: 7.9%
- Arcadia, FL MSA: 7.9%
Is Pensacola a Buyer’s or Seller’s Market?
One question you have to ask yourself before buying or selling property is, “Is Pensacola a buyer’s or seller’s market?”
As of August 2023, Realtor.com calls the Pensacola housing market a seller’s paradise. This means the demand for homes is higher than the supply.
If you are looking to sell a home, there couldn’t be a better time. People looking to buy a home in Pensacola may need to dig deeper into their pockets to find their dream properties.
Factors Driving the Pensacola Housing Market
Numerous factors contribute to the Pensacola housing market’s ability to maintain a competitive edge, rendering it an ideal choice for real estate investments.
Here are some of these factors:

The Economy
Pensacola’s economy has been doing well, especially in the last decade. Jobs are easy to find, and that’s super important for a place to grow.
Pensacola has a strong connection to the military, which helps keep the Pensacola housing market competitive and the economy stable.
The region boasts some big military bases nearby, like Naval Air Station Pensacola, which has a bunch of military folks and civilians working there, mainly training pilots and hosting the famous Blue Angels.
They also teach cybersecurity stuff at Corry Station. There’s another base called Naval Air Station Whiting Field, not too far away, where they train naval aviators. And if you drive about an hour, you’ll hit Eglin Air Force Base in Fort Walton Beach.
These bases bring in new residents regularly and keep Pensacola home prices solid. Most military folks don’t stay in one place for too long, so many of them rent homes when they come to NAS Pensacola or Whiting Field NAS.
Educational Institutions
Pensacola also sees a consistent influx of students from several colleges in the city.
The University of West Florida, located in the northeastern part of Pensacola, is the biggest one. It covers a vast area, making it the third-largest state university in terms of land.
Currently, it has thousands of students attending various programs.
Another educational institution in the area is Pensacola State College, formerly known as Pensacola Junior College.
Similar to the military personnel, many of these students only stay in the area for a few years while pursuing their education, making them potential renters during their time here.
This student population significantly contributes to the high demand for rental properties in the area, adding yet another compelling reason to consider investing in the Pensacola housing market.

The Weather and the Beaches
Beautiful scenery and great weather are big reasons why people visit or move to a place.
Pensacola is no exception, offering some of the most stunning beaches in the country along with a pleasant subtropical climate all year.
In 2022, Visit Pensacola reported that over 2.5 million tourists visited Pensacola. Many of them go to Pensacola because of its incredibly gorgeous white sandy beaches.
If you head southwest of Pensacola, you’ll find Perdido Key Beach, and to the east, there’s Pensacola Beach.
Pensacola Beach consistently gets high praise and is often ranked as one of the most beautiful beaches in the United States and even worldwide.
The beaches along the Florida panhandle, including Pensacola and Navarre Beach, are known for having some of the whitest sand anywhere on Earth. When you combine that with the turquoise waters, it creates one of the most breathtaking views in the country.
Many snowbirds, tired of harsh winter weather, seek refuge in Florida, and these stunning views attract thousands of tourists every year.
With these tourists, there’s also a need for temporary housing. So, those picturesque beaches provide another excellent reason to consider investing in the Pensacola housing market.
Property Affordability
When it comes to real estate investing, location matters, but what counts is the price and the money you make from it.
Luckily, Pensacola home prices score highly in affordability, making it one of the most budget-friendly places in Florida. Property Club even labeled it the most affordable city in the whole state.
This means you can find investment opportunities without breaking the bank while still having a great location that attracts new residents and visitors.
Pensacola’s price-to-rent ratio, which compares how much it costs to buy a home to what you can earn from renting it out, was the best in Florida, according to Southern Living’s comparison of beach towns.
Southern Living even named Pensacola the #1 place to buy a vacation home in Florida last year. With its stunning white beaches and strong tourist appeal, there’s always a high demand for vacation rentals here.
This makes the Pensacola housing market a fantastic choice for investing in both short-term vacation rentals and long-term rental properties. It’s also a popular spot for people looking to buy vacation or second homes.

What Are the Best Neighborhoods to Live in Pensacola?
Pensacola could be an ideal choice if you’re seeking an attractive, family-oriented, and enjoyable city.
The Pensacola housing market offers an excellent living environment with a variety of beautiful homes available for purchase.
Wondering what are the best neighborhoods to live in Pensacola? Here are some neighborhoods you can consider in the Pensacola housing market:
- Tiger Point
Tiger Point is a neighborhood in Santa Rosa County that is about a 30-minute drive from downtown Pensacola and only a few minutes’ drive from the beach. So, it’s having the best of both worlds. You can enjoy a peaceful country vibe while still being pretty close to the city.
- Baymarc
Baymarc is a fantastic neighborhood located close to downtown Pensacola. It features a variety of charming historic houses, making it suitable for residents of all backgrounds, whether you’re a family, a retiree, or simply looking for a fresh start.
Being in such close proximity to downtown Pensacola is a significant advantage. It gives residents easy access to the city’s restaurants, bars, and activities without the need for a lengthy commute.
- Bridlewood
Bridlewood is an emerging neighborhood featuring recently constructed homes near Mobile Highway and Steeplechase Boulevard. Situated at the heart of Pensacola, it provides convenient access to the city’s highlights. The neighborhood boasts top-notch schools, entertaining attractions, and fine dining options.
- East Hill
East Hill is an upscale neighborhood boasting charming homes in a prime Pensacola location. If you’re in search of a tranquil, pedestrian-friendly, bike-friendly, and welcoming community, East Hill is an ideal choice.
This neighborhood has a well-established reputation for its beauty and historical significance, dating back to the 1800s. Over the years, many families have cherished their time in this picturesque district.
Mallory Heights
Mallory Heights offers an excellent option if you’re seeking an affordable coastal home. While it comes with a median real estate price, it compensates for this with its breathtaking views and charming homes.
The majority of residences in Mallory Heights are medium- to large-sized single-family homes and small apartment buildings.
Many of these homes exude a historic charm, with construction dates ranging from as early as the 1940s to the late 1960s, although most were built between 1970 and 1999.
- Related Articles : Orlando Real Estate Market Forecast
Final Thoughts
If you are looking to plunge into the Pensacola housing market, get hold of a reputable real estate agent. Real estate agents possess in-depth knowledge of their local markets, so it’s advisable to seek out one whose approach you appreciate and leverage their expertise to your advantage.
But that doesn’t mean skipping due diligence on the pros and cons of living in Pensacola. You still need to research to make the right decision.